PM CP Performance Analytics
Use the PM CP Performance Analytics to review project performance.
If Organization security is used in Costpoint, users will only see the projects that belong to the organizations they have access to. However, if Project Manager Security is enable they will see only projects they are assigned to as PM. The dashboard has 5 tabs covering a different view of the project data. Note that all project results use Target Rates for actual results.
There are 5 tabs with different views of the project performance data:
- Overview - This tab shows inception-to-date information leveraging the current period flag, so it will always show the Inception To Date information through the current month which is controlled by your CBI Administrator. Measures include Revenue, Profit, and Profit % as well as charts that show the top 5 and bottom 5 performing projects.
- Current Period Review Analysis - This tab focuses on the current period performance showing revenue versus budget and gross profit (that is, revenue less direct expenses).
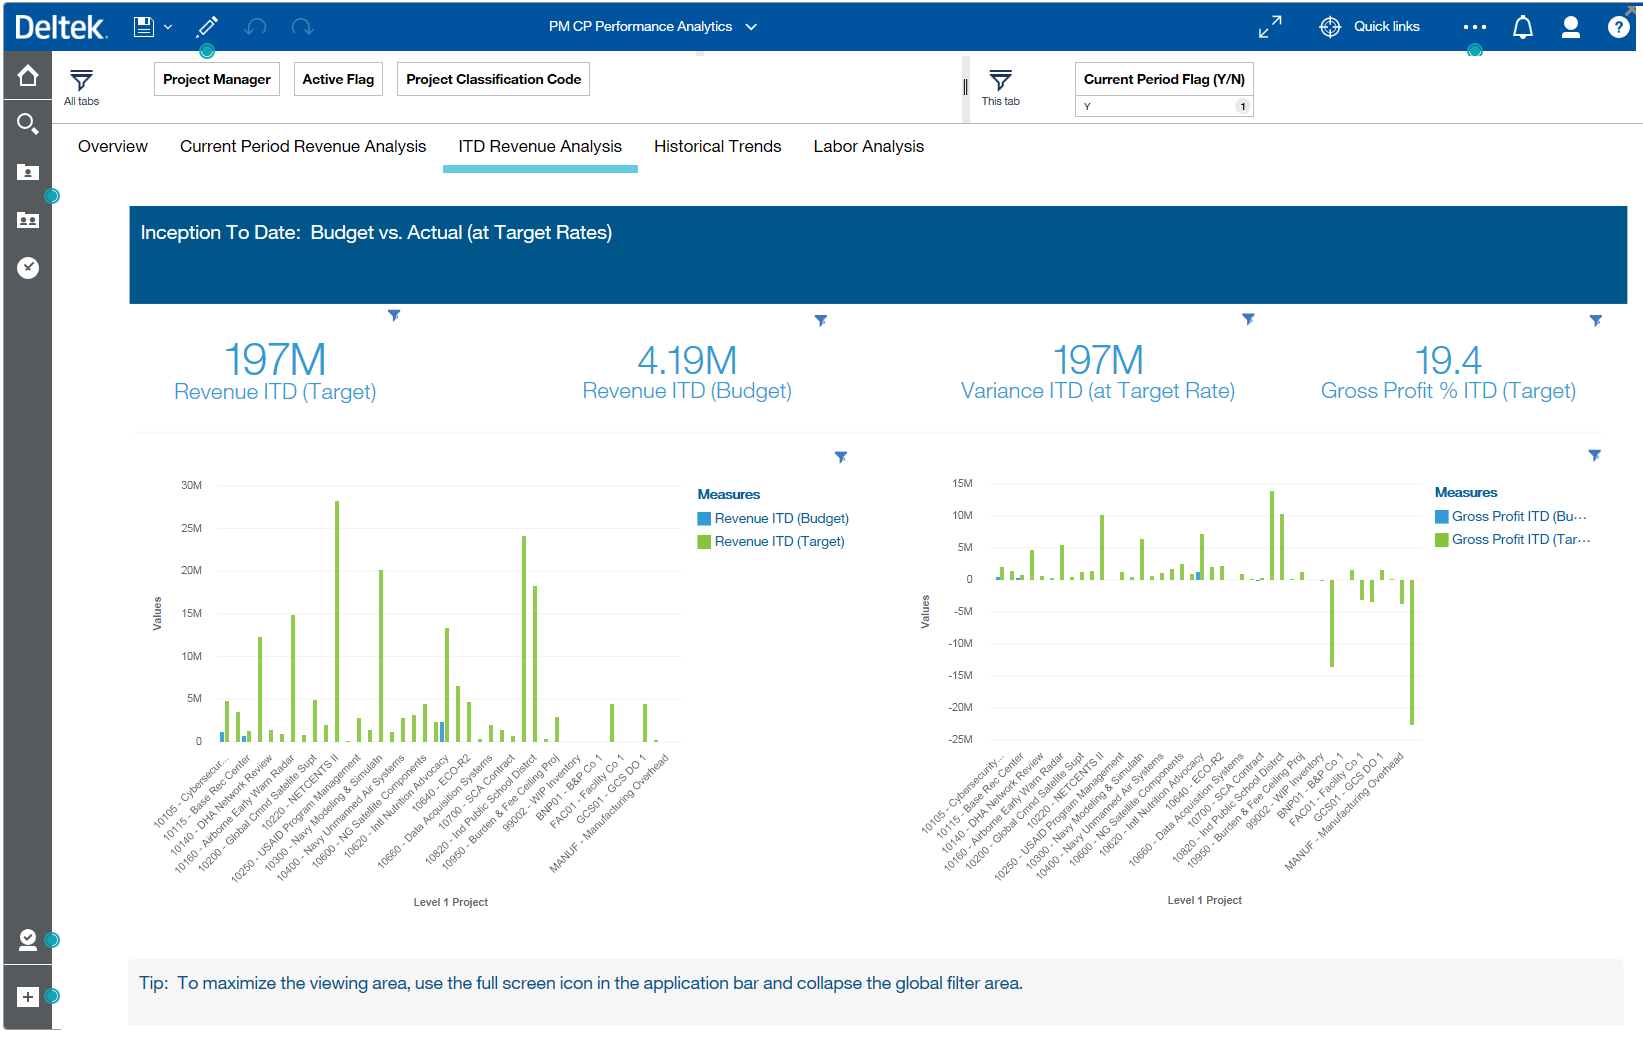
- ITD Revenue Analysis - This tab will show Inception To Date revenue for all projects to get an idea of historical performance showing revenue versus budget and gross profit.
- Historical Trends - This tab shows comparison trends of actual versus budget for each project leveraging the Repeat (row) capability in Dashboards to automatically create a separate chart for each project at level 1.
- Labor Analysis - This tab leverages the "tree map" visualization where each block is an employee, the size of the block represents the number of hours spent on the project. Note that since budgeted hours are not available in Costpoint projects module, leveraging Deltek Project Planning can be used to track hour variances.