Opportunity Dashboard
The Opportunity Dashboard displays consolidated metric views for the Opportunities module.
The dashboard contains the following tabs:
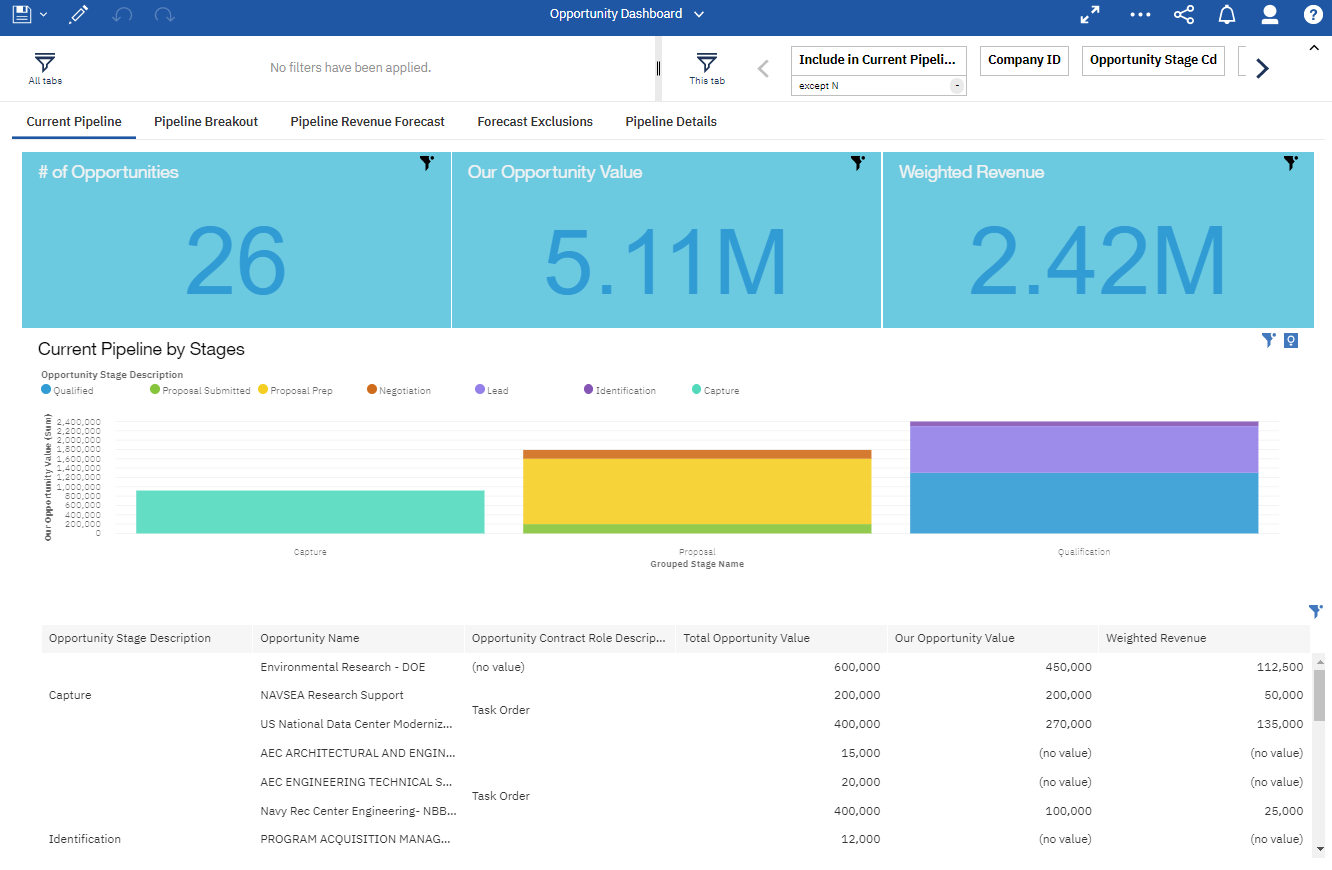
- Current Pipeline: This tab displays the detailed list of opportunities based on specified pipeline stages. This provides the sales team a visual representation of the value of the opportunities broken out by each of the stages to help determine where to prioritize efforts to close deals.
- Pipeline By Stages: This tab displays the list of opportunities, their stage, and value by month.
- Pipeline Breakout: This tab displays the summary of opportunity pipeline amounts organized by stage based on the anticipated award date. This lets you assess future revenue for the company.
- Pipeline Revenue Forecast: This tab displays the Opportunity Value and Weighted Revenue, spread evenly over months. The Opportunity Value Forecast Spread displays the estimated start date and estimated dates of the opportunities, and evenly spreads the opportunity value over the months. The Weighted Revenue Forecast Spread displays the estimated start date and estimated completion dates of the opportunities, and evenly spreads the weighted revenue over the months.
- Forecast Exclusions: This tab displays the opportunities that require additional data before they can be included in the Revenue Forecast. Required data may include the start date, end date, or the Our Opportunity Value/Weighted Value data.
- Pipeline Details: This tab displays the summary of opportunity pipeline amounts that are grouped and shows the total percentage by each stage.
- Leads Analysis: This tab displays leads grouped by source.