Manufacturing Dashboard
The Manufacturing Dashboard displays data for manufacturing orders (MOs) and Engineering Change Notices (ECNs) that are used to document changes to a Part/Rev..
Manufacturing Tab
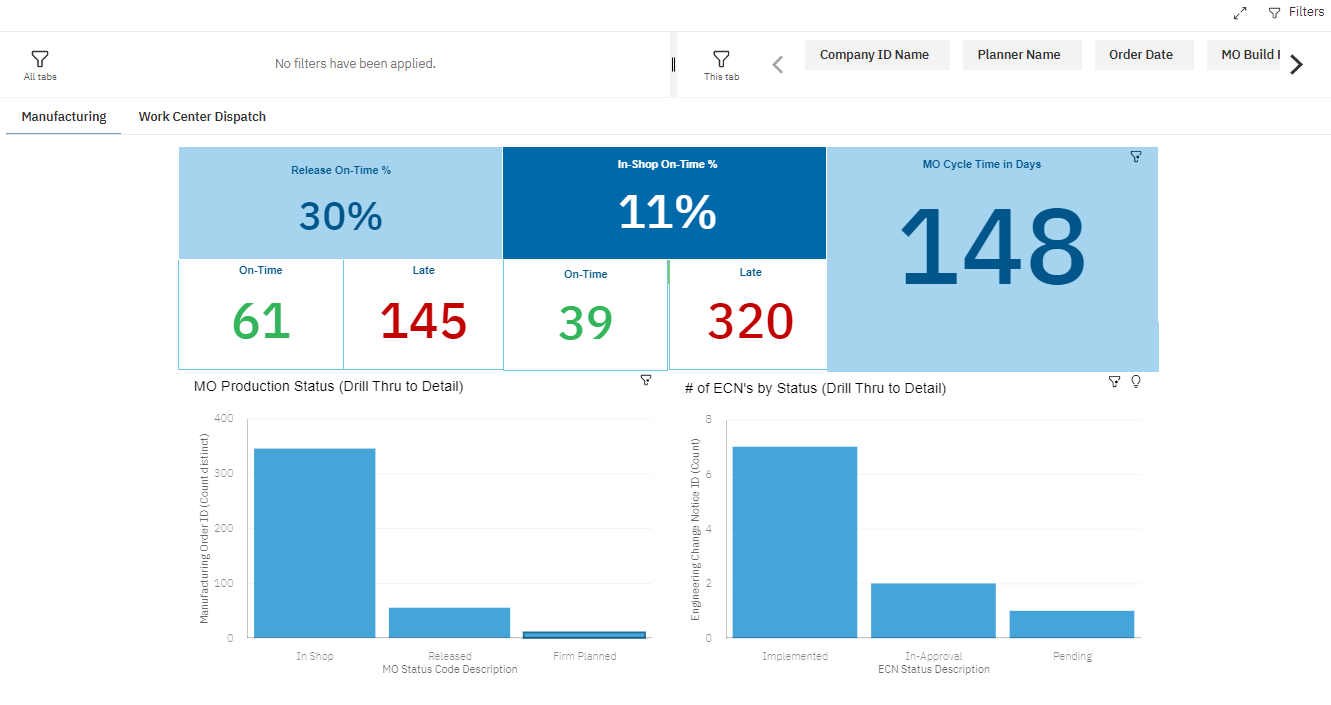
The Manufacturing tab provides statistics for MOs in various stages of the manufacturing process, including:
- Release On-Time & In-Shop On-Time %: These key performance indicators (KPIs) let you monitor planner performance and see when they are on-time or late with moving MOs to these stages in the process. The Release Date vs Planned Release Drill Thru and In-Shop Date vs Planned In-Shop Date Drill Thru reports show you MO details grouped by planner to reveal the build part and the difference in days from planned to actual.
- MO Cycle Time in Days: This area shows the overall average number of days it takes an MO to complete from the date it was ordered to completion. This KPI adjusts as you interact with other areas on the dashboard, including filters by part, planner, and project.
- MO Production Status (Drill Thru to Detail):This area shows where the in-process MOs are in the production, with a count for each status. Use the MO Production Status Details Drill Thru report to see a breakdown of each status by planner and build part. You can also see the number of days the MOs have been in their current status, the planned due date, need date, and MO completion percentage.
- # of ECN's by Status (Drill Thru to Detail): This area shows a count of in-process ECNS that are Approved, In-Approval, Pending, Implemented or Rejected. Use the ECN Impact to MOs Drill Thru report to see the MOs impacted by ECNs.
An ECN can impact an MO when:
- The ECN alters or changes a build part.
- The MO is using the original part on the ECN as a component to construct the build part on the MO.
Work Center Dispatch Tab
The Work Center Dispatch tab displays radial charts and table views of MOs that are active, upcoming, and not yet scheduled. Filter the dashboard to see MO information for specific work centers. You also can select a Radial Chart or individual MO ID and then click the Drill Through icon to open the Operation Status Drill Thru report.
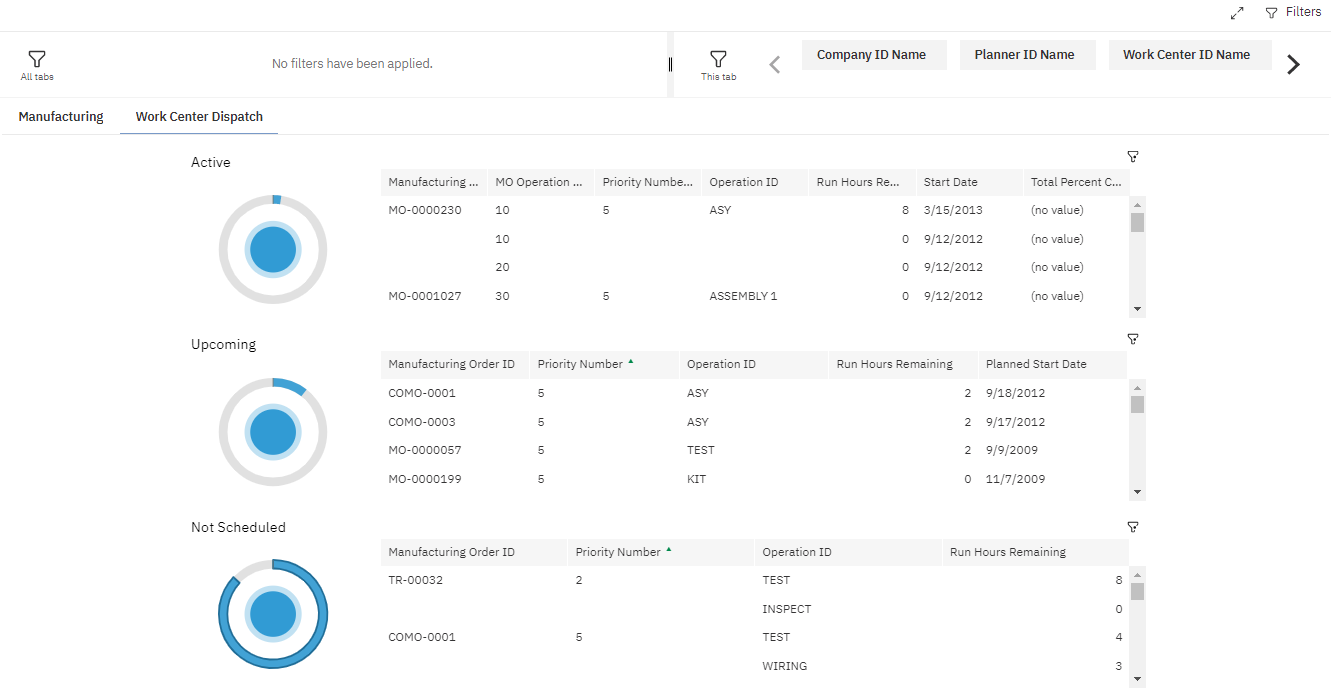
MO information is organized by the following:
- Active: This section shows data for MO Current Operations, including the start date, percent complete, and the total run hours remaining for each MO. A drill thru report shows more details for the MOs in the Active list.
- Upcoming: This section includes MO Operations that are not yet the Current Operation, but have a planned start date. For each MO ID listed, its Priority, Operation, Total Run Hours Remaining, and the Planned Start Date is shown. A drill thru report shows more details for the MOs in the Upcoming list.
- Not Scheduled: This section includes data for MO Operations that do not have a planned start date. For each MO ID listed, its Priority, Operation, and Total Run Hours Remaining is shown. A drill thru report shows more details for the MOs in the Not Scheduled list.
Operation Status Drill Thru
The Operation Status Drill Thru report provides more MO information, including the Planned Start Date, Completed Quantity, Percent Complete, and the MO Critical Ratio value.
Use the MO Critical Ratio to identify potential priority needs. The lower the ratio value, the higher the priority and possible need for action. This ratio does not take into account the load on work centers, multiple shifts, or weekends.
When viewing the MO Critical Ratio:
- If the value is negative, then the order is past due and there are insufficient hours to complete the work on schedule without expediting order.
- If the value is 0, then the Due Date is equal to the Current Date.
- If the value is 1, then the hours of work remaining is equal to the hours remaining before the order is due, or the order is on time.
- If the value is greater than 1, then there are less hours of work remaining than hours remaining before the order is due.
- If the value is 9999, then the order might not have time loaded in the router.